Date created: Tuesday, December 31, 2013 11:43:10 AM. Last modified: Saturday, April 1, 2017 8:35:43 AM
95th Percentile Accuracy with RRDTools
See Also:
An explenation of 95th percentile, mean, media and mode: 95th Percentile and Mean/Median/Mode
Keeping RRD data accuracy without consolidation, in this example of 5 minute steps for 2 years brings problems. Example rrd file that has 2 years of accuracy;
me@server:~$ rrdtool info /var/lib/cacti/rra/router1_traffic_in_11666.rrd
filename = "/var/lib/cacti/rra/router1_traffic_in_11666.rrd"
rrd_version = "0003"
step = 300
last_update = 1386606906
ds[traffic_in].type = "COUNTER"
ds[traffic_in].minimal_heartbeat = 600
ds[traffic_in].min = 0.0000000000e+00
ds[traffic_in].max = 1.0000000000e+09
ds[traffic_in].last_ds = "1601976753"
ds[traffic_in].value = 1.6551294400e+06
ds[traffic_in].unknown_sec = 0
ds[traffic_out].type = "COUNTER"
ds[traffic_out].minimal_heartbeat = 600
ds[traffic_out].min = 0.0000000000e+00
ds[traffic_out].max = 1.0000000000e+08
ds[traffic_out].last_ds = "72738702"
ds[traffic_out].value = 1.5563000000e+04
ds[traffic_out].unknown_sec = 0
rra[0].cf = "AVERAGE"
rra[0].rows = 230400
rra[0].pdp_per_row = 1
rra[0].xff = 5.0000000000e-01
rra[0].cdp_prep[0].value = NaN
rra[0].cdp_prep[0].unknown_datapoints = 0
rra[0].cdp_prep[1].value = NaN
rra[0].cdp_prep[1].unknown_datapoints = 0
rra[1].cf = "MAX"
rra[1].rows = 230400
rra[1].pdp_per_row = 1
rra[1].xff = 5.0000000000e-01
rra[1].cdp_prep[0].value = NaN
rra[1].cdp_prep[0].unknown_datapoints = 0
rra[1].cdp_prep[1].value = NaN
rra[1].cdp_prep[1].unknown_datapoints = 0
230400 rows in each rra, recording data in 5 minute steps; (230400*5)=1152000 minutes, 1152000/60/24/365 = 2.19 years.
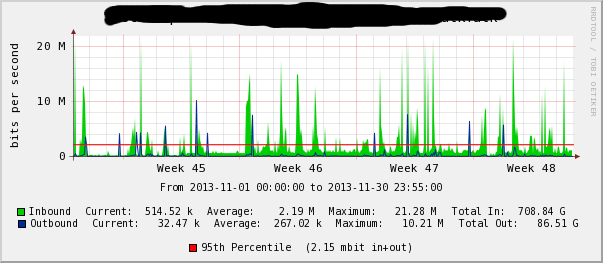
Assuming the raw data gathered via SNMP for example is dropped into the MAX RRA by Cacti (also, for example) then we pull data from there using DEF:in="my.rrd":traffic_in:MAX, which gives a graph like the following;
Cacti typically produces graphs using a DEF with average CF like so; DEF:in="my.rrd":traffic_in:AVERAGE which give a graph like the following;
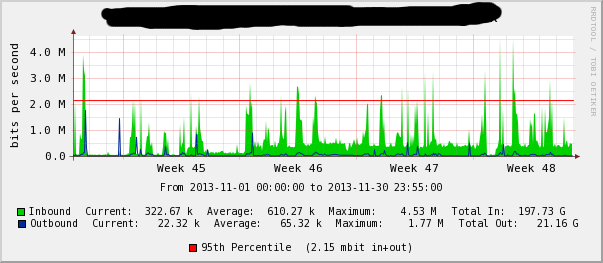
The 95th percentile is calculated externally for both of these graphs which are then created with the command below (the 95th percentile is passed as a COMMENT and HRULE). The important difference here is that the graph areas are different, the current/avg/max/total values are different. Even though a customer may be billed based up on the 95th percentile, it shows them as having wildly different usage patterns using the two difference Consolidate Functions MAX and AVERAGE, even though we are using 5 minute steps for 2 years and these graphs where generated from data roughly 1 to 2 months old;
/usr/bin/rrdtool graph /tmp/test.png
--imgformat=PNG
--start=1383264000
--end=1385855700
--title='Test'
--rigid
--base=1000
--height=120
--width=500
--alt-autoscale-max
--lower-limit=0
COMMENT:"From 2013-11-01 00\:00\:00 to 2013-11-30 23\:55\:00\c"
COMMENT:" \c"
--vertical-label='bits per second'
--slope-mode
--font TITLE:10:
--font AXIS:8:
--font LEGEND:7:
--font UNIT:8:
DEF:in="/var/lib/cacti/rra/router1_traffic_in_11666.rrd":traffic_in:MAX
DEF:out="/var/lib/cacti/rra/router1_traffic_in_11666.rrd":traffic_out:MAX
VDEF:inbytesavg=in,AVERAGE
VDEF:outbytesavg=out,AVERAGE
CDEF:inbytesmod=in,UN,inbytesavg,in,IF
CDEF:outbytesmod=out,UN,outbytesavg,out,IF
CDEF:speedin=in,8,*
CDEF:speedout=out,8,*
VDEF:intotal=inbytesmod,TOTAL
VDEF:outtotal=outbytesmod,TOTAL
AREA:speedin#00CF00FF:"Inbound"
GPRINT:speedin:LAST:"Current\:%8.2lf %s"
GPRINT:speedin:AVERAGE:"Average\:%8.2lf %s"
GPRINT:speedin:MAX:"Maximum\:%8.2lf %s"
GPRINT:intotal:"Total In\:%8.2lf %s"
COMMENT:" \c"
LINE1:speedout#002A97FF:"Outbound"
GPRINT:speedout:LAST:"Current\:%8.2lf %s"
GPRINT:speedout:AVERAGE:"Average\:%8.2lf %s"
GPRINT:speedout:MAX:"Maximum\:%8.2lf %s"
GPRINT:outtotal:"Total Out\:%8.2lf %s \c"
COMMENT:" \c"
HRULE:2151061#FF0000FF:"95th Percentile"
COMMENT:"(2.15 mbit in+out)\c"
PRINT:intotal:"%8.2lf%SBs In"
PRINT:outtotal:"%8.2lf%SBs Out"
PRINT:speedin:AVERAGE:"%8.2lf%sbps In"
PRINT:speedout:AVERAGE:"%8.2lf%sbps Out"
PRINT:speedin:MAX:"%8.2lf%sbps In"
PRINT:speedout:MAX:"%8.2lf%sbps Out"
The reason this is happening is because there is a second stage of consolidation occuring here, there's not just consolidation occuring to the data as it is stored in each RRA. RRDTools in the above command is being forced to consolidate data as it draws the graph. The example graphs above are 500 pixels wide but one month of data is 8640x 5 minute samples. Even though my RRAs aren't consolidating data in storage, it is consolidated using the CF function in the DEF statement to fit in the pixel range.
Below is only the last 10 samples of both RRAs (traffic_in and traffic_out) of my test RRD for brevity showing that all samples are the same when pulling from MAX or AVERAGE. This is what is expected based on the "rrdtool info" output above;
me@server:/$ sudo /usr/bin/rrdtool fetch --start=1383264000 --end=1385855700 /var/lib/cacti/rra/router1_traffic_in_11666.rrd AVERAGE | tail -n 10
1385853300: 4.9921194667e+03 1.8153038000e+03
1385853600: 6.1680891000e+04 2.7375534667e+03
1385853900: 6.0396357933e+04 3.1846755333e+03
1385854200: 6.1290392667e+03 2.2950537333e+03
1385854500: 6.2416655467e+04 2.7198662000e+03
1385854800: 6.4314943667e+04 3.0344772667e+03
1385855100: 5.0561721333e+03 1.8135508000e+03
1385855400: 6.3321694000e+04 4.0585688667e+03
1385855700: 5.9577035933e+04 3.3799286000e+03
1385856000: 6.4475479035e+03 2.8579428004e+03

me@server:/$ sudo /usr/bin/rrdtool fetch --start=1383264000 --end=1385855700 /var/lib/cacti/rra/router1_traffic_in_11666.rrd MAX | tail -n 10
1385853300: 4.9921194667e+03 1.8153038000e+03
1385853600: 6.1680891000e+04 2.7375534667e+03
1385853900: 6.0396357933e+04 3.1846755333e+03
1385854200: 6.1290392667e+03 2.2950537333e+03
1385854500: 6.2416655467e+04 2.7198662000e+03
1385854800: 6.4314943667e+04 3.0344772667e+03
1385855100: 5.0561721333e+03 1.8135508000e+03
1385855400: 6.3321694000e+04 4.0585688667e+03
1385855700: 5.9577035933e+04 3.3799286000e+03
1385856000: 6.4475479035e+03 2.8579428004e+03
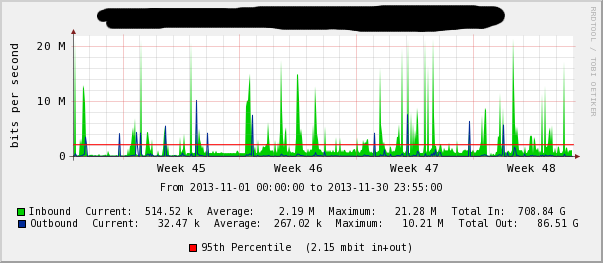
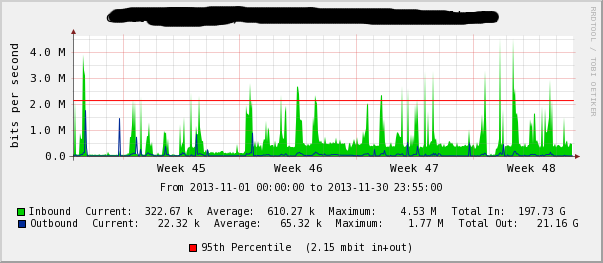
With 8640 samples per month drawing a graph 8640 pixels wide allows each PDP (primary data point) to be graphed. The following two graphs are created with width=8640 but one used DEF=MAX and the other DEF=AVERGE, they are the same because neither the data in the RRAs is consolidated nor in the drawing of the graphs using this extra large width (click the images for a larger view);
DEF=MAX

DEF=AVERAGE

Squashing these graphs back down we can use a REDUCE function to alter the outcome of the consolidate function. Using the following DEF statement creates the same graph as the MAXIMUM graph above even though the Consolidate Function is AVERAGE, each CDP (consolidation data point) is calculated (reduced) using the additionally specified REDUCE function;
DEF:in="my.rrd":traffic_in:AVERAGE:reduce=MAX
Below is DEF:in="my.rrd":traffic_in:MAX:reduce=AVERGE which produced the inverse to the graph directly above, and at the top of this page;
Previous page: 95th Percentile and Mean/Median/Mode
Next page: 95th Percentile Calculation